The Noth Face & Vans Web Optimization
Objective:
The primary goal of this project was to identify pain points, enhance the user experience, and drive key metrics. Specifically, we aimed to:
Increase the add-to-cart rate
Increase conversion rate
Reduce checkout time
Increase product engagement
Leadership Focus:
Leadership emphasized a "low effort, high impact" approach to maximize results with minimal effort.Team Composition:
The team consisted of:2 UX/UI Designers
1 UX Researcher
2 Developers
1 QA Specialist
Business Analysts
Project Manager
Product Owner
Brand Representatives
Project Kickoff:
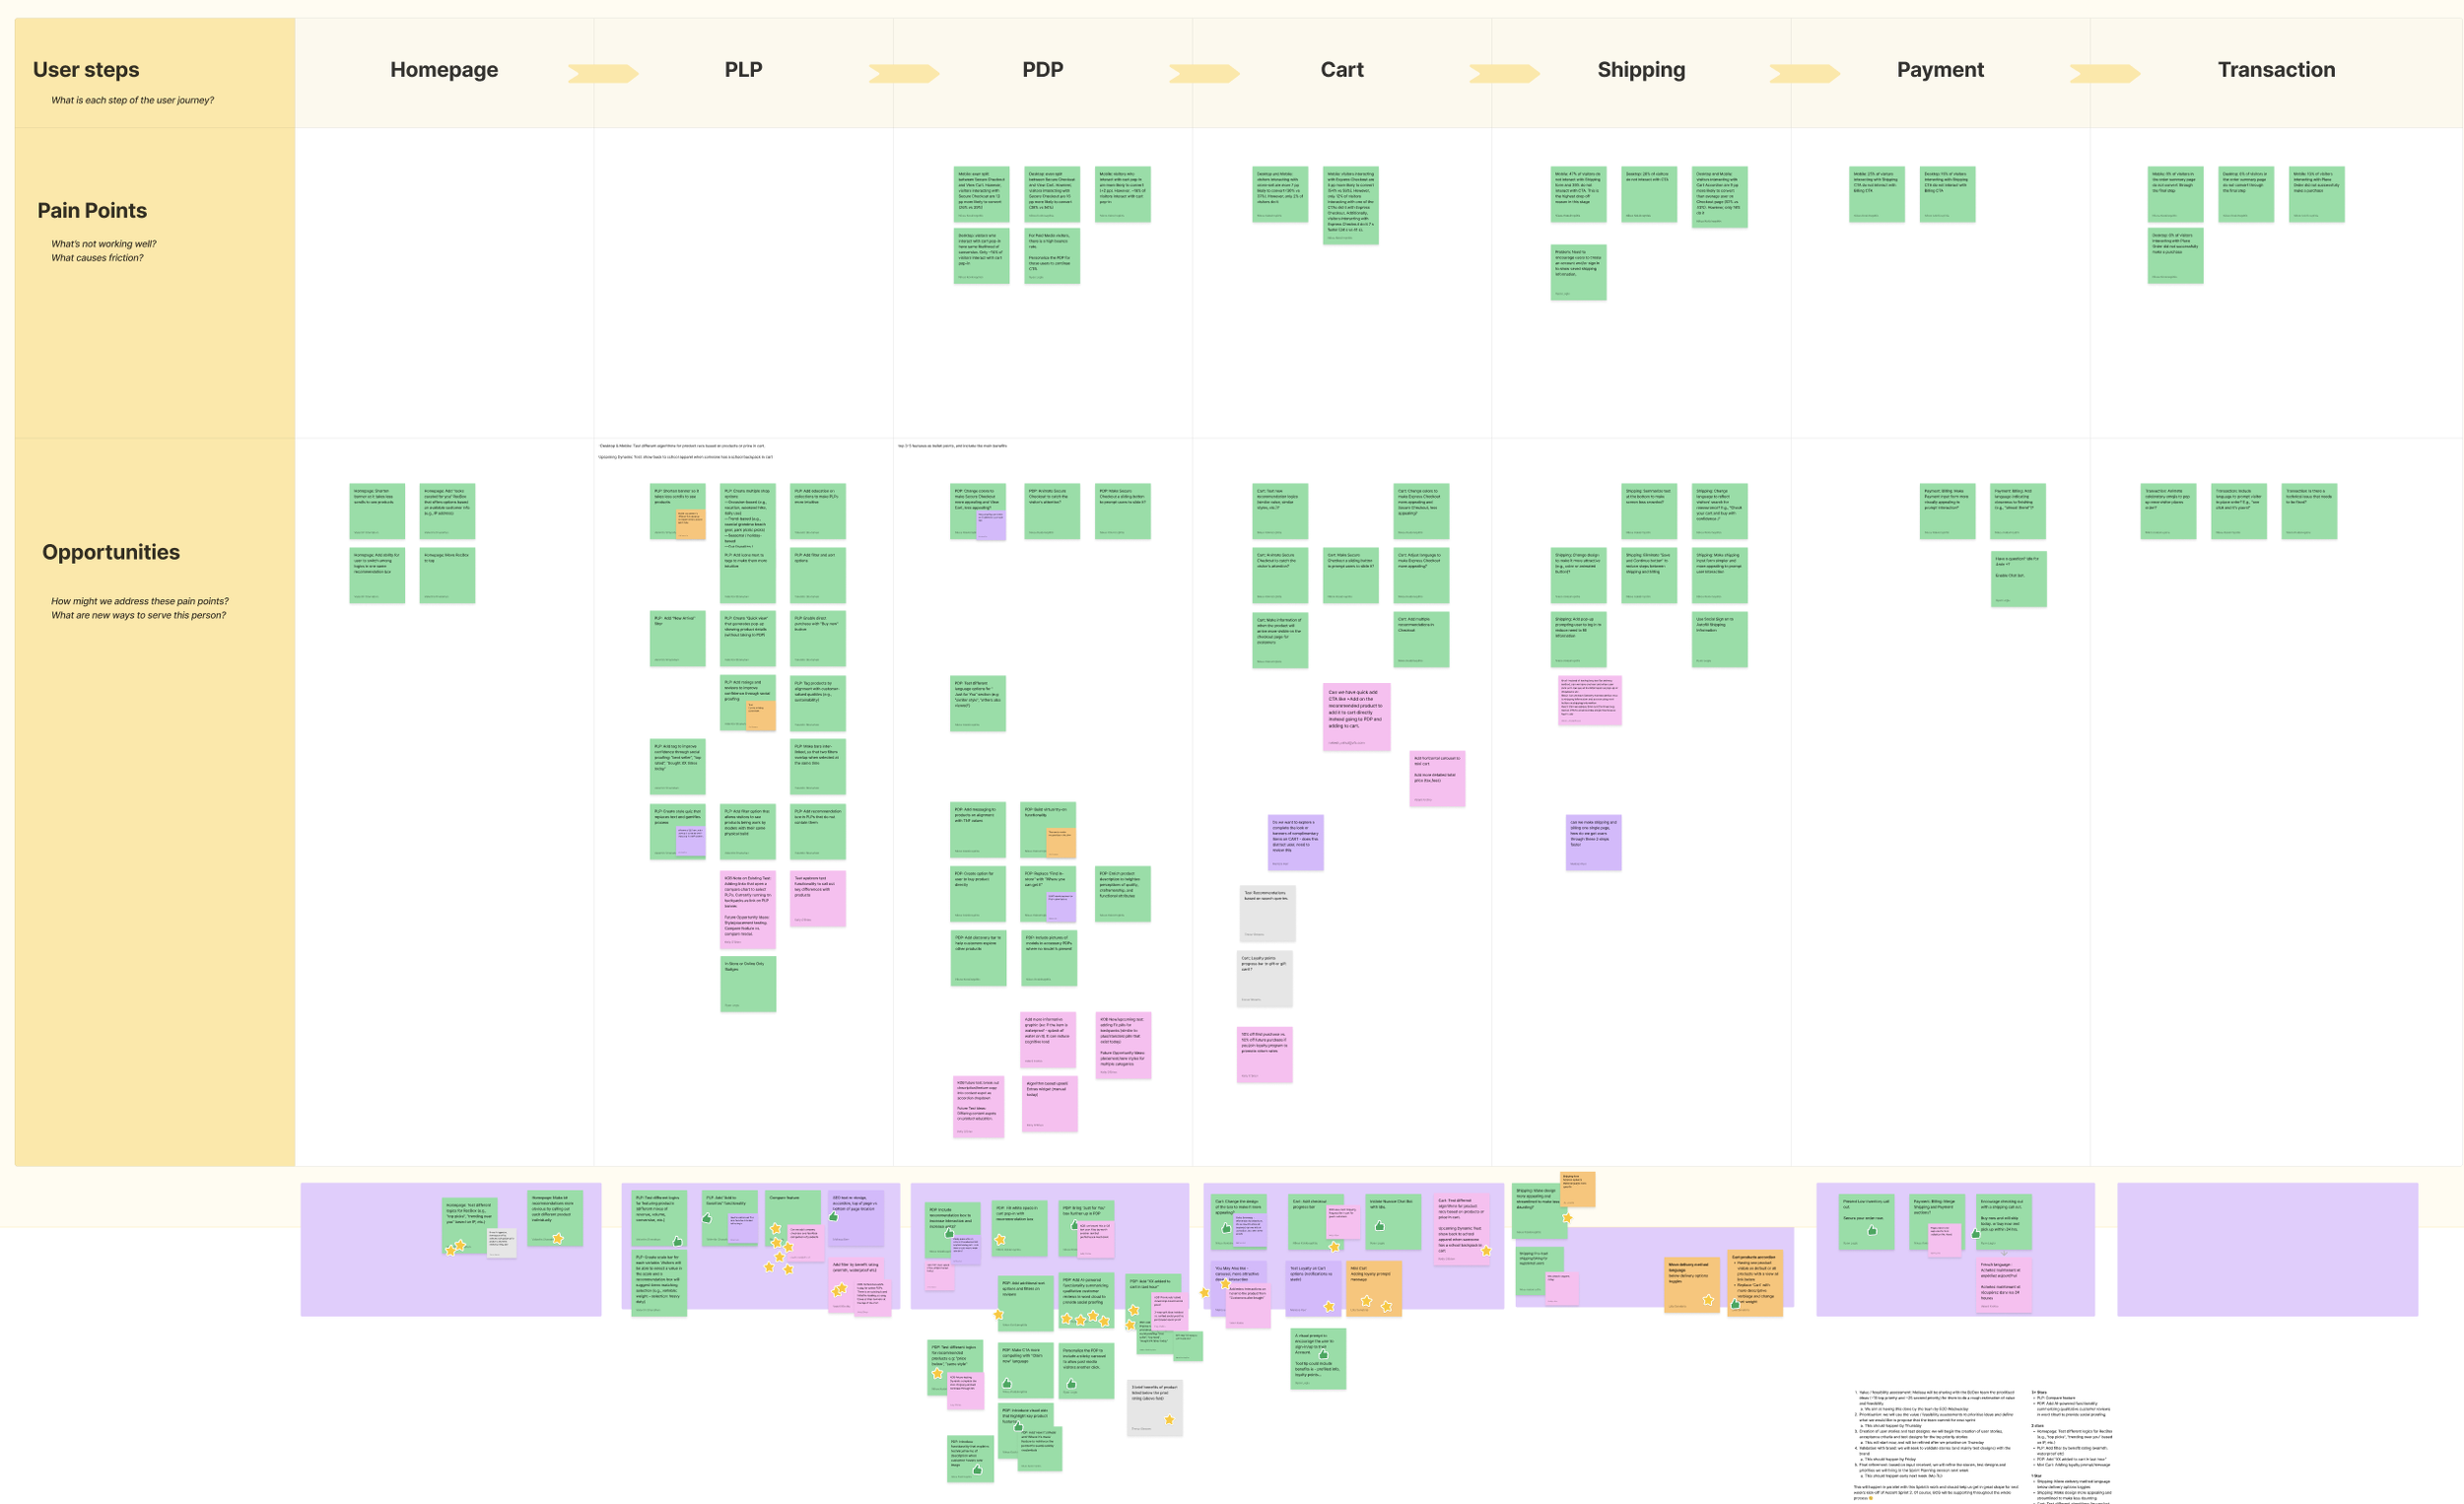
We initiated the project with a brainstorming session that included:Input from other UX designers and researchers
Collective ideation to improve websites for The North Face.com and Vans.com
Prioritizing ideas as a team
Additionally, we gathered user insights from the support team, compiling an extensive list of pain points collected through the Feedback feature on each site.
Prioritized Ideas:
We used an effort/impact matrix to prioritize tasks, focusing first on those with low effort and high impact. Here is some task listed below:
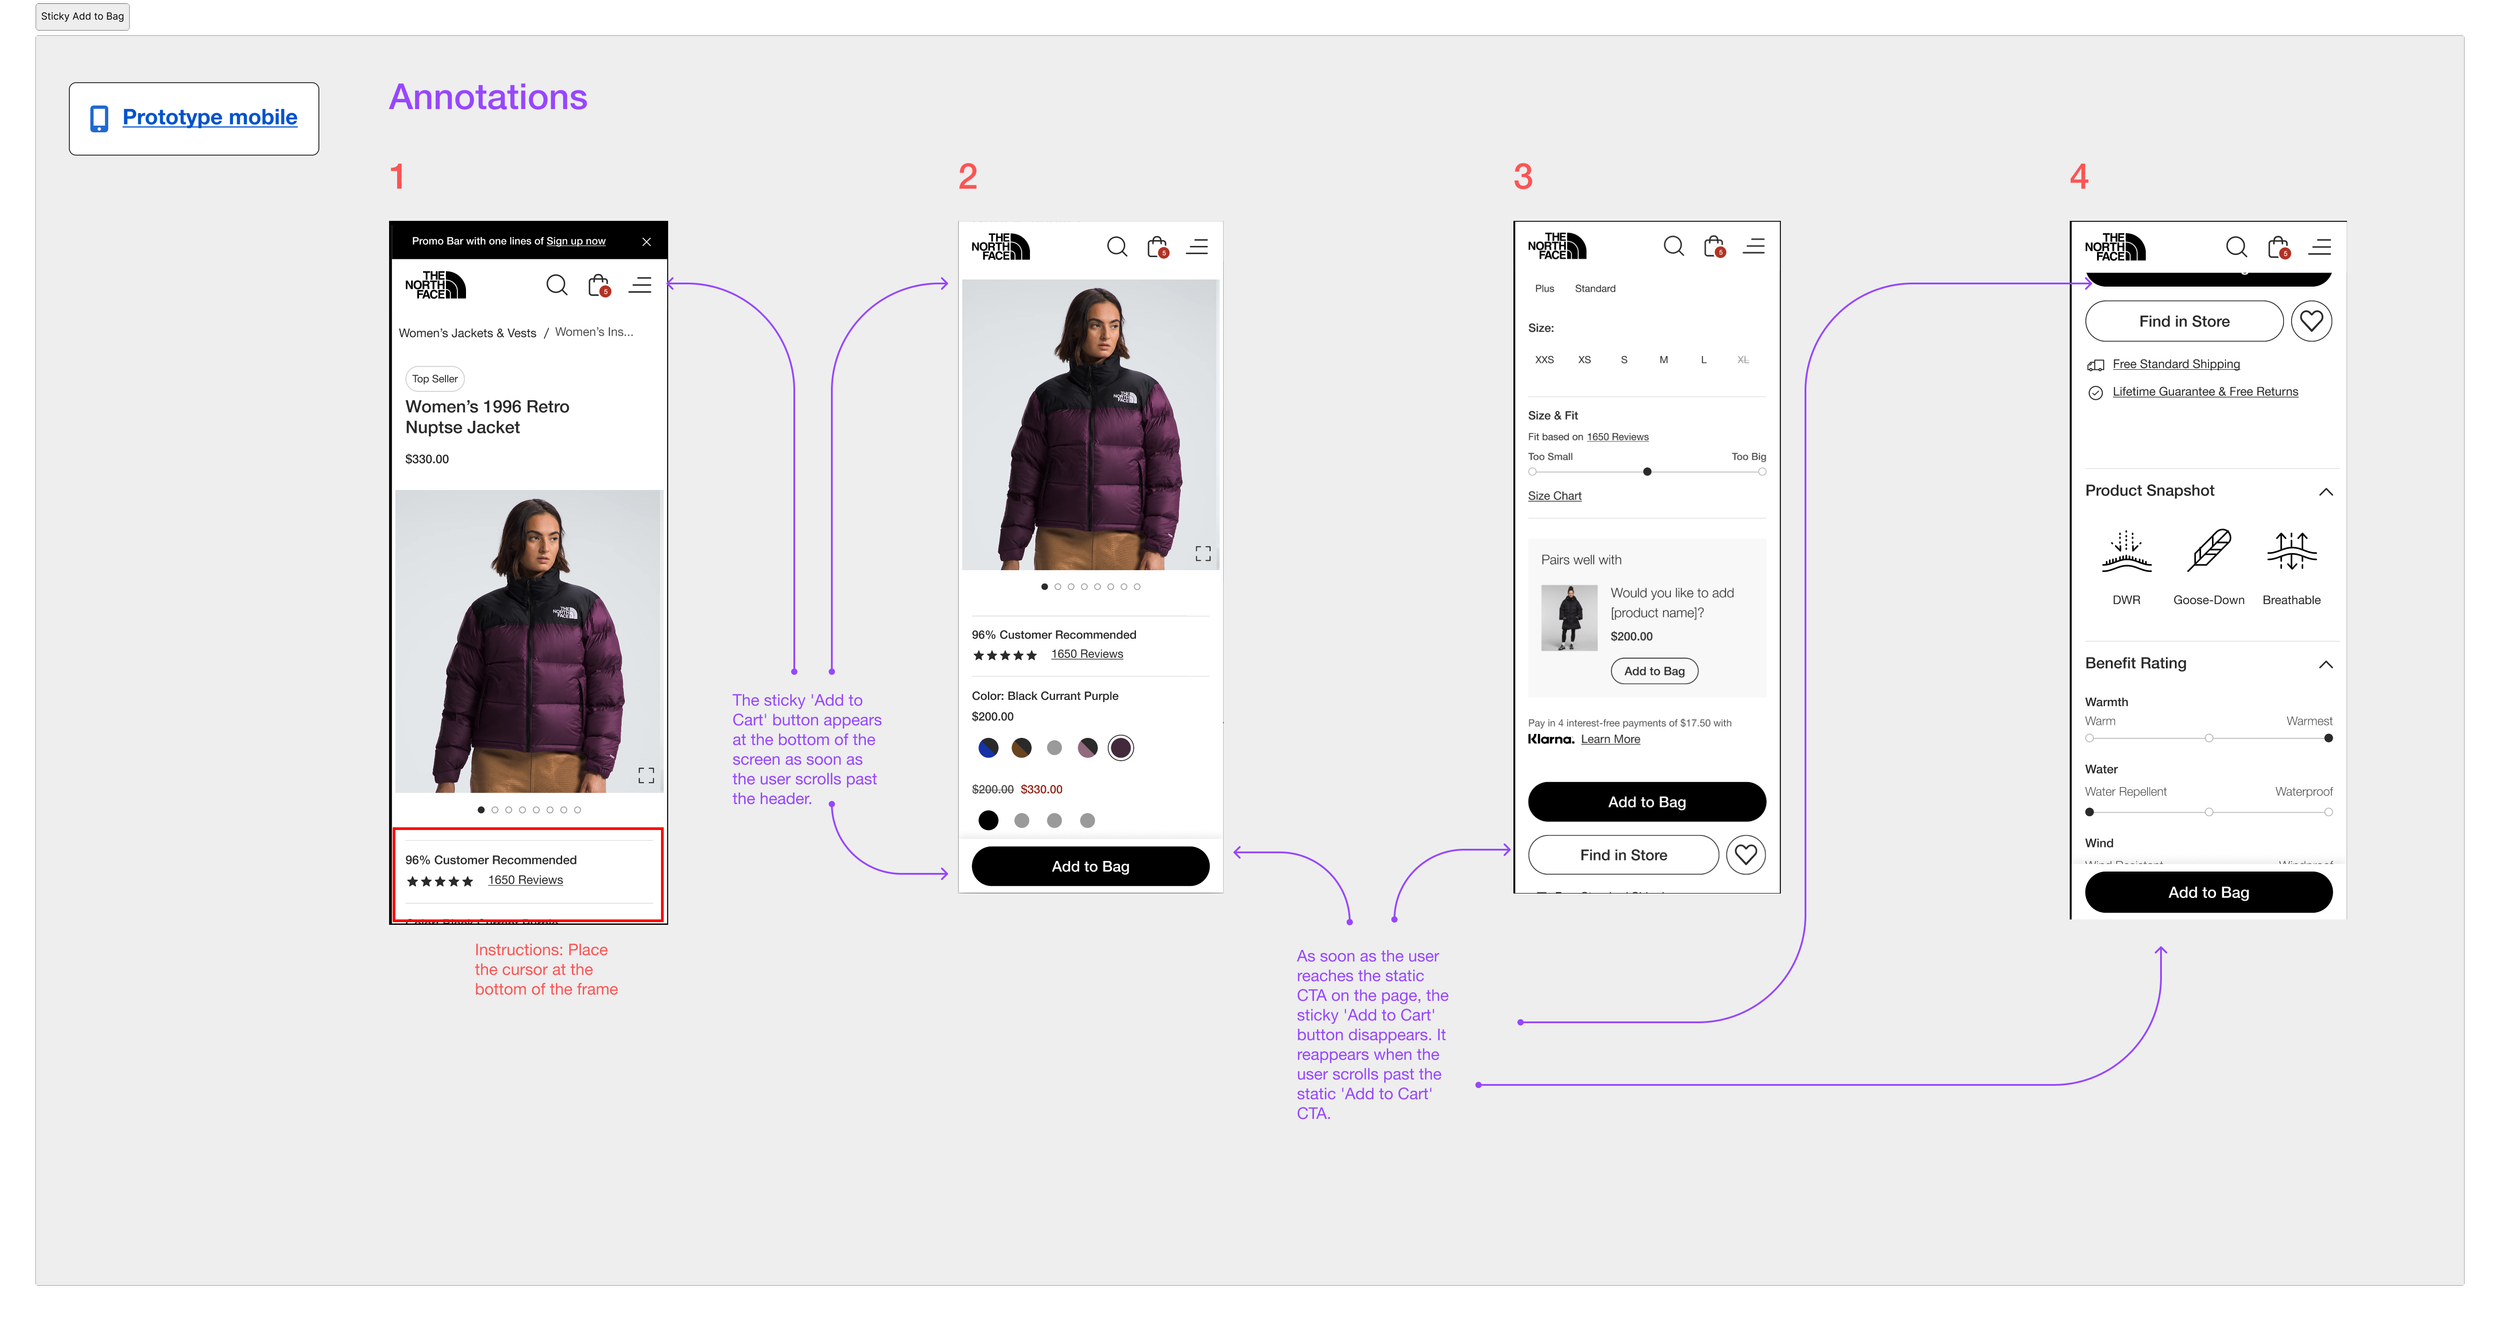
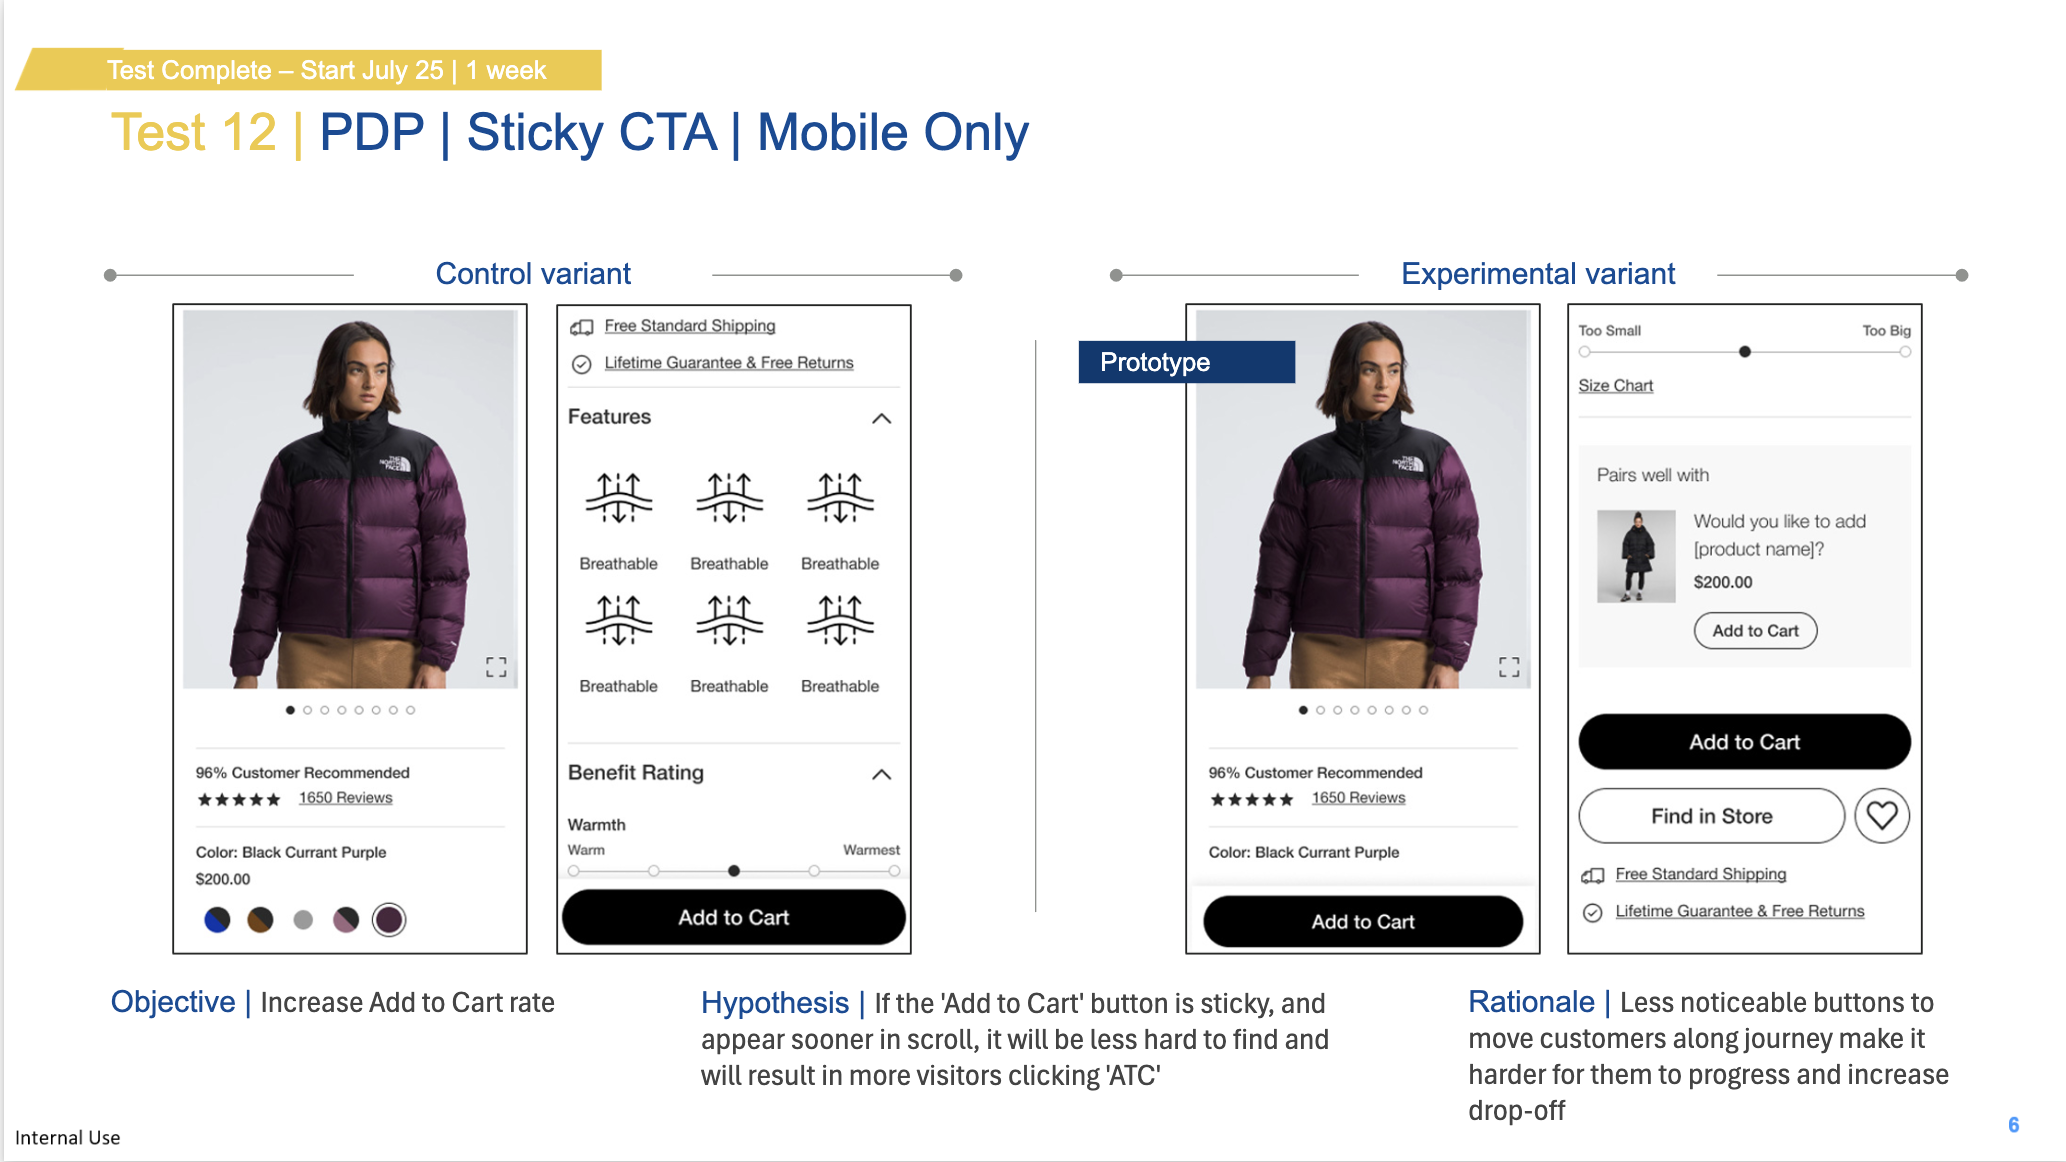
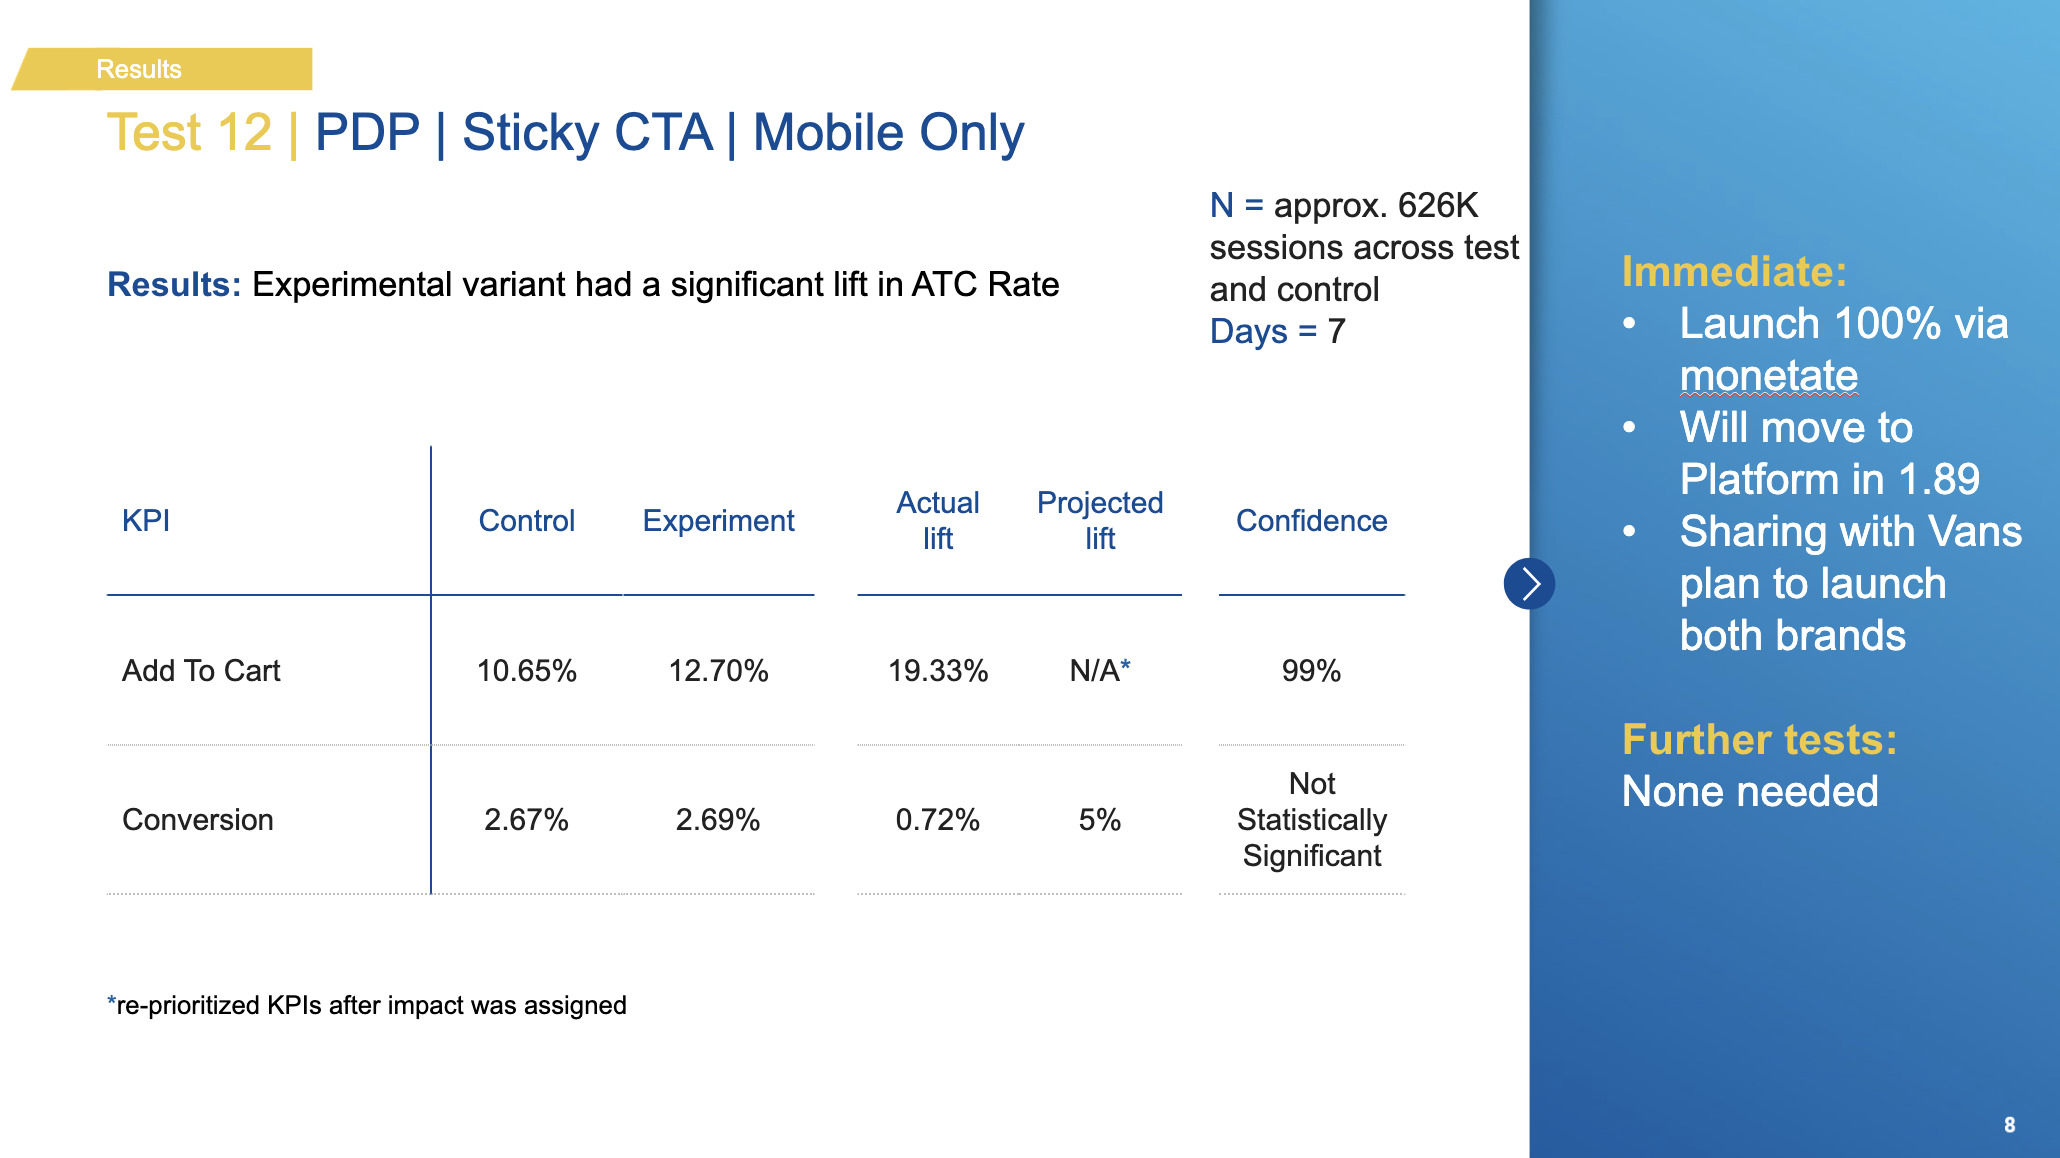
Add a sticky CTA to the Product Details Page
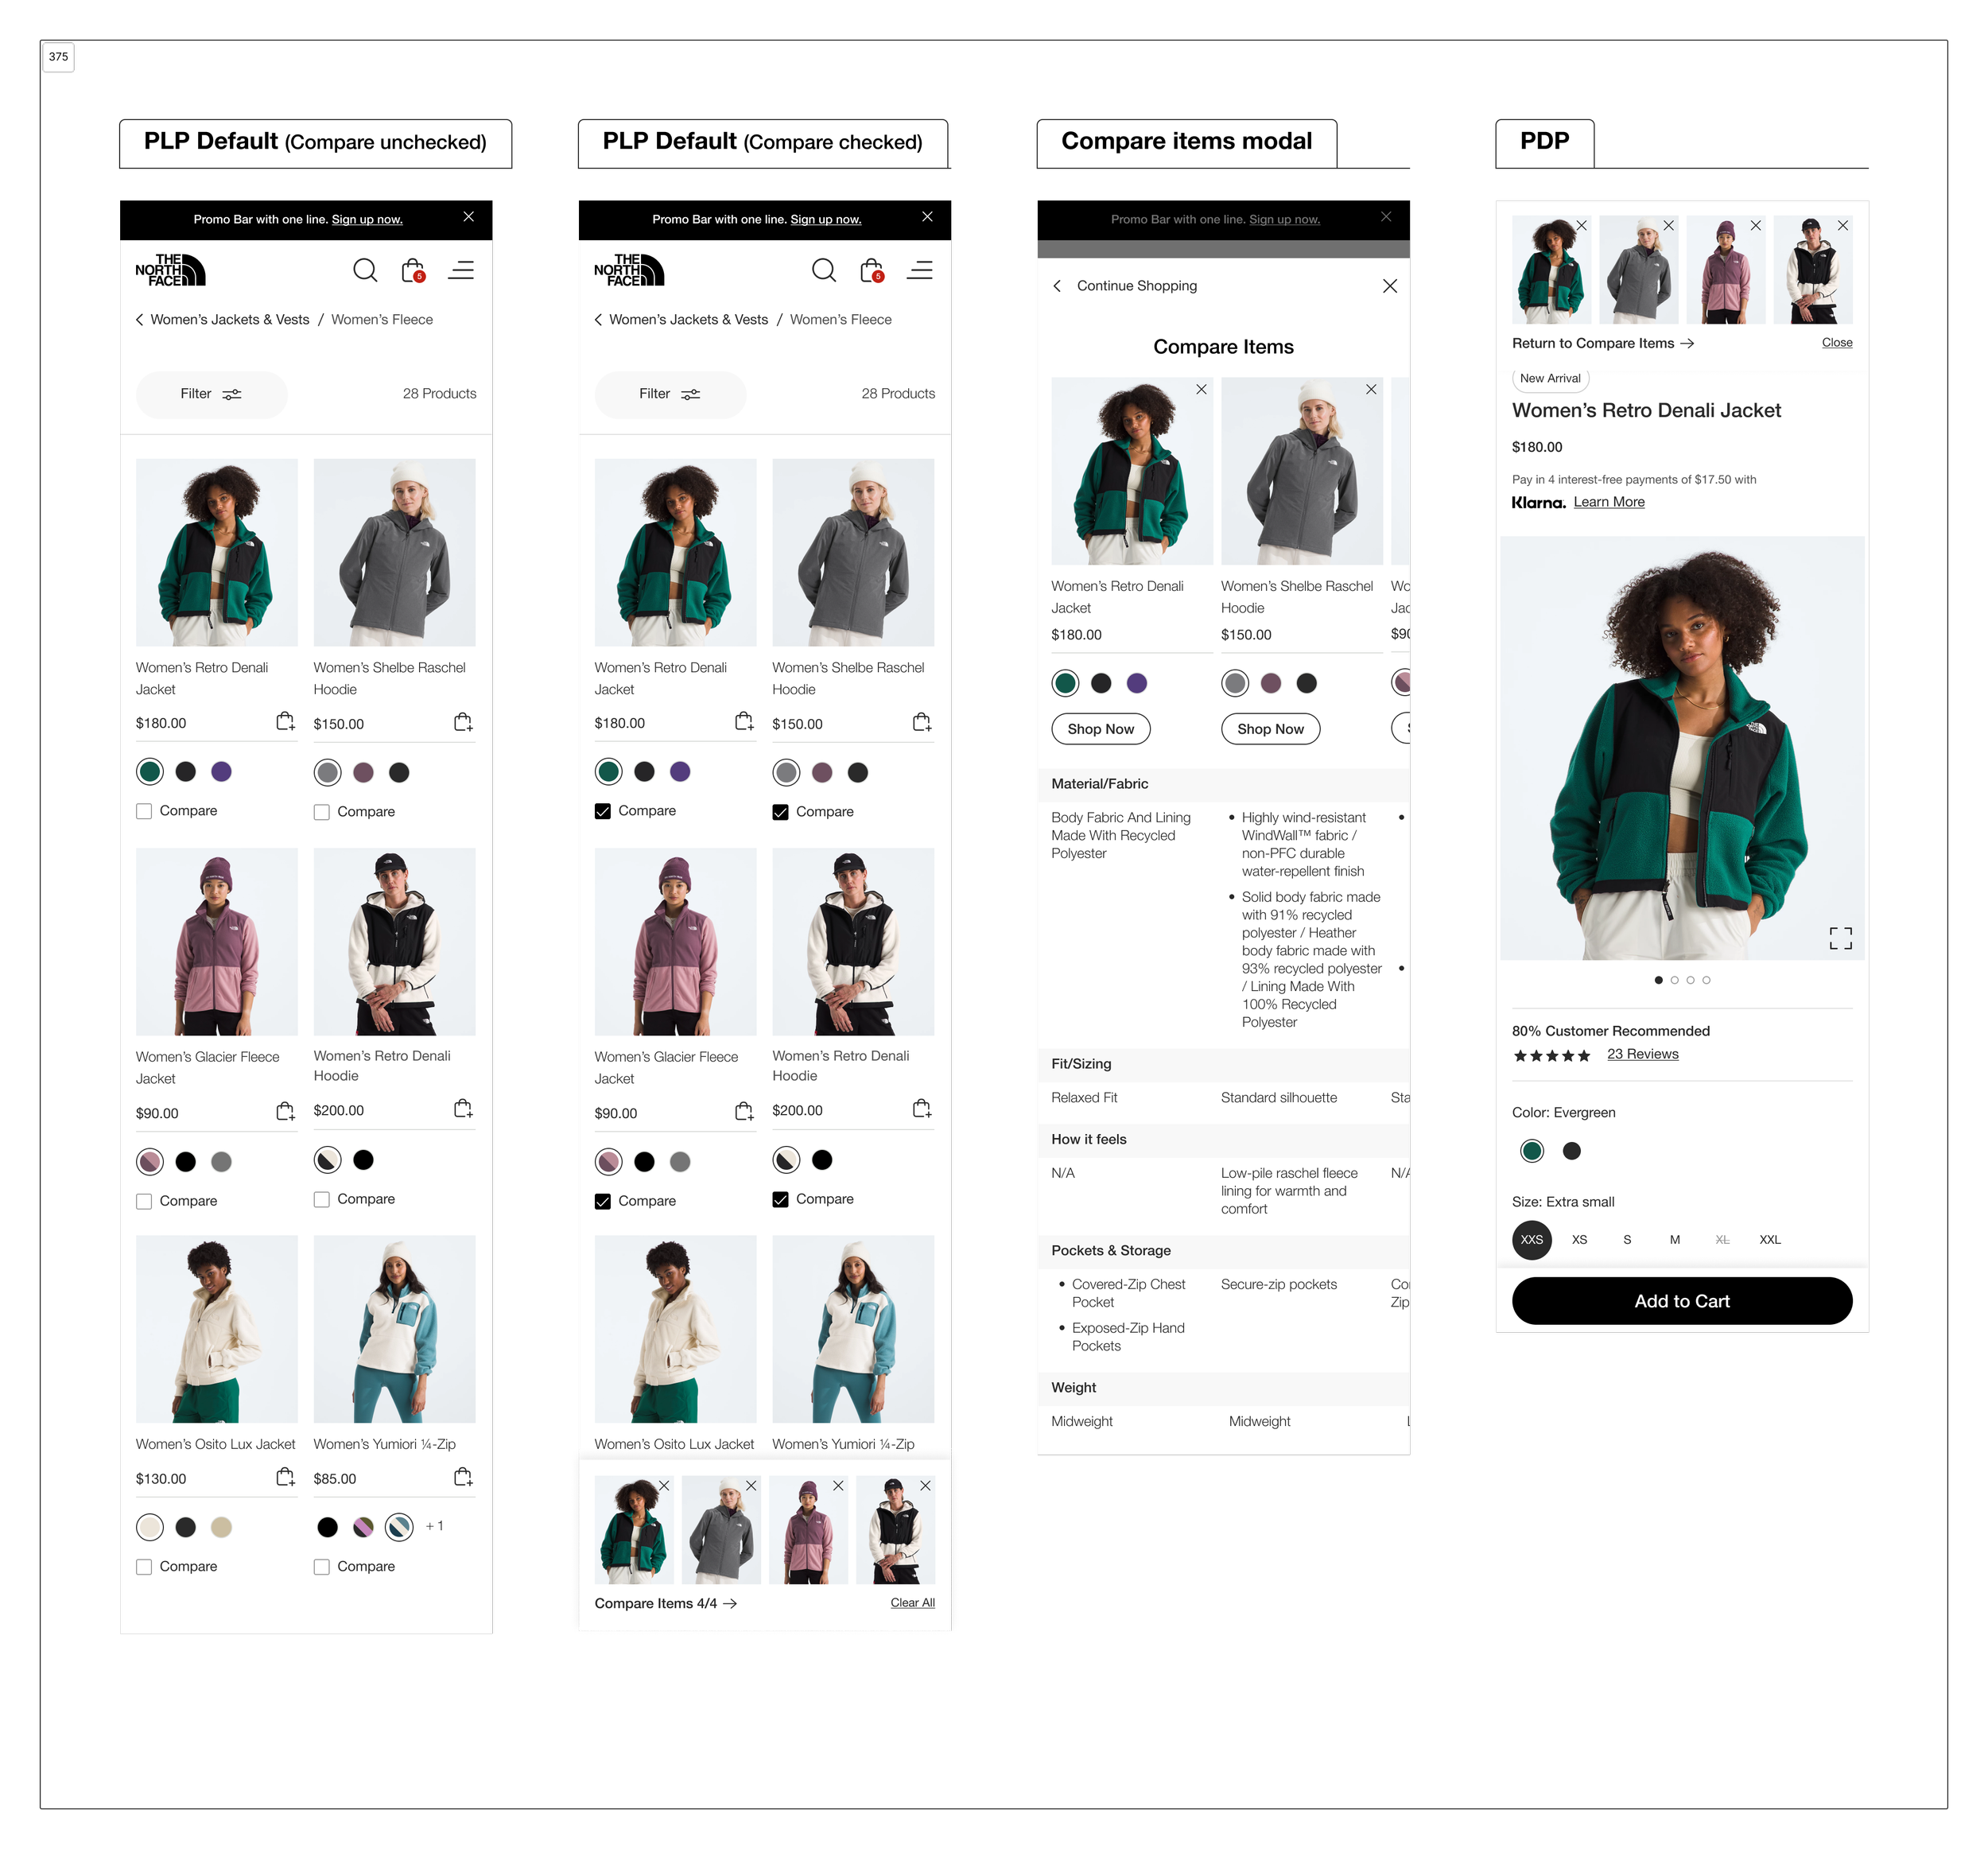
Introduce a Compare Feature to the Product Listing Page
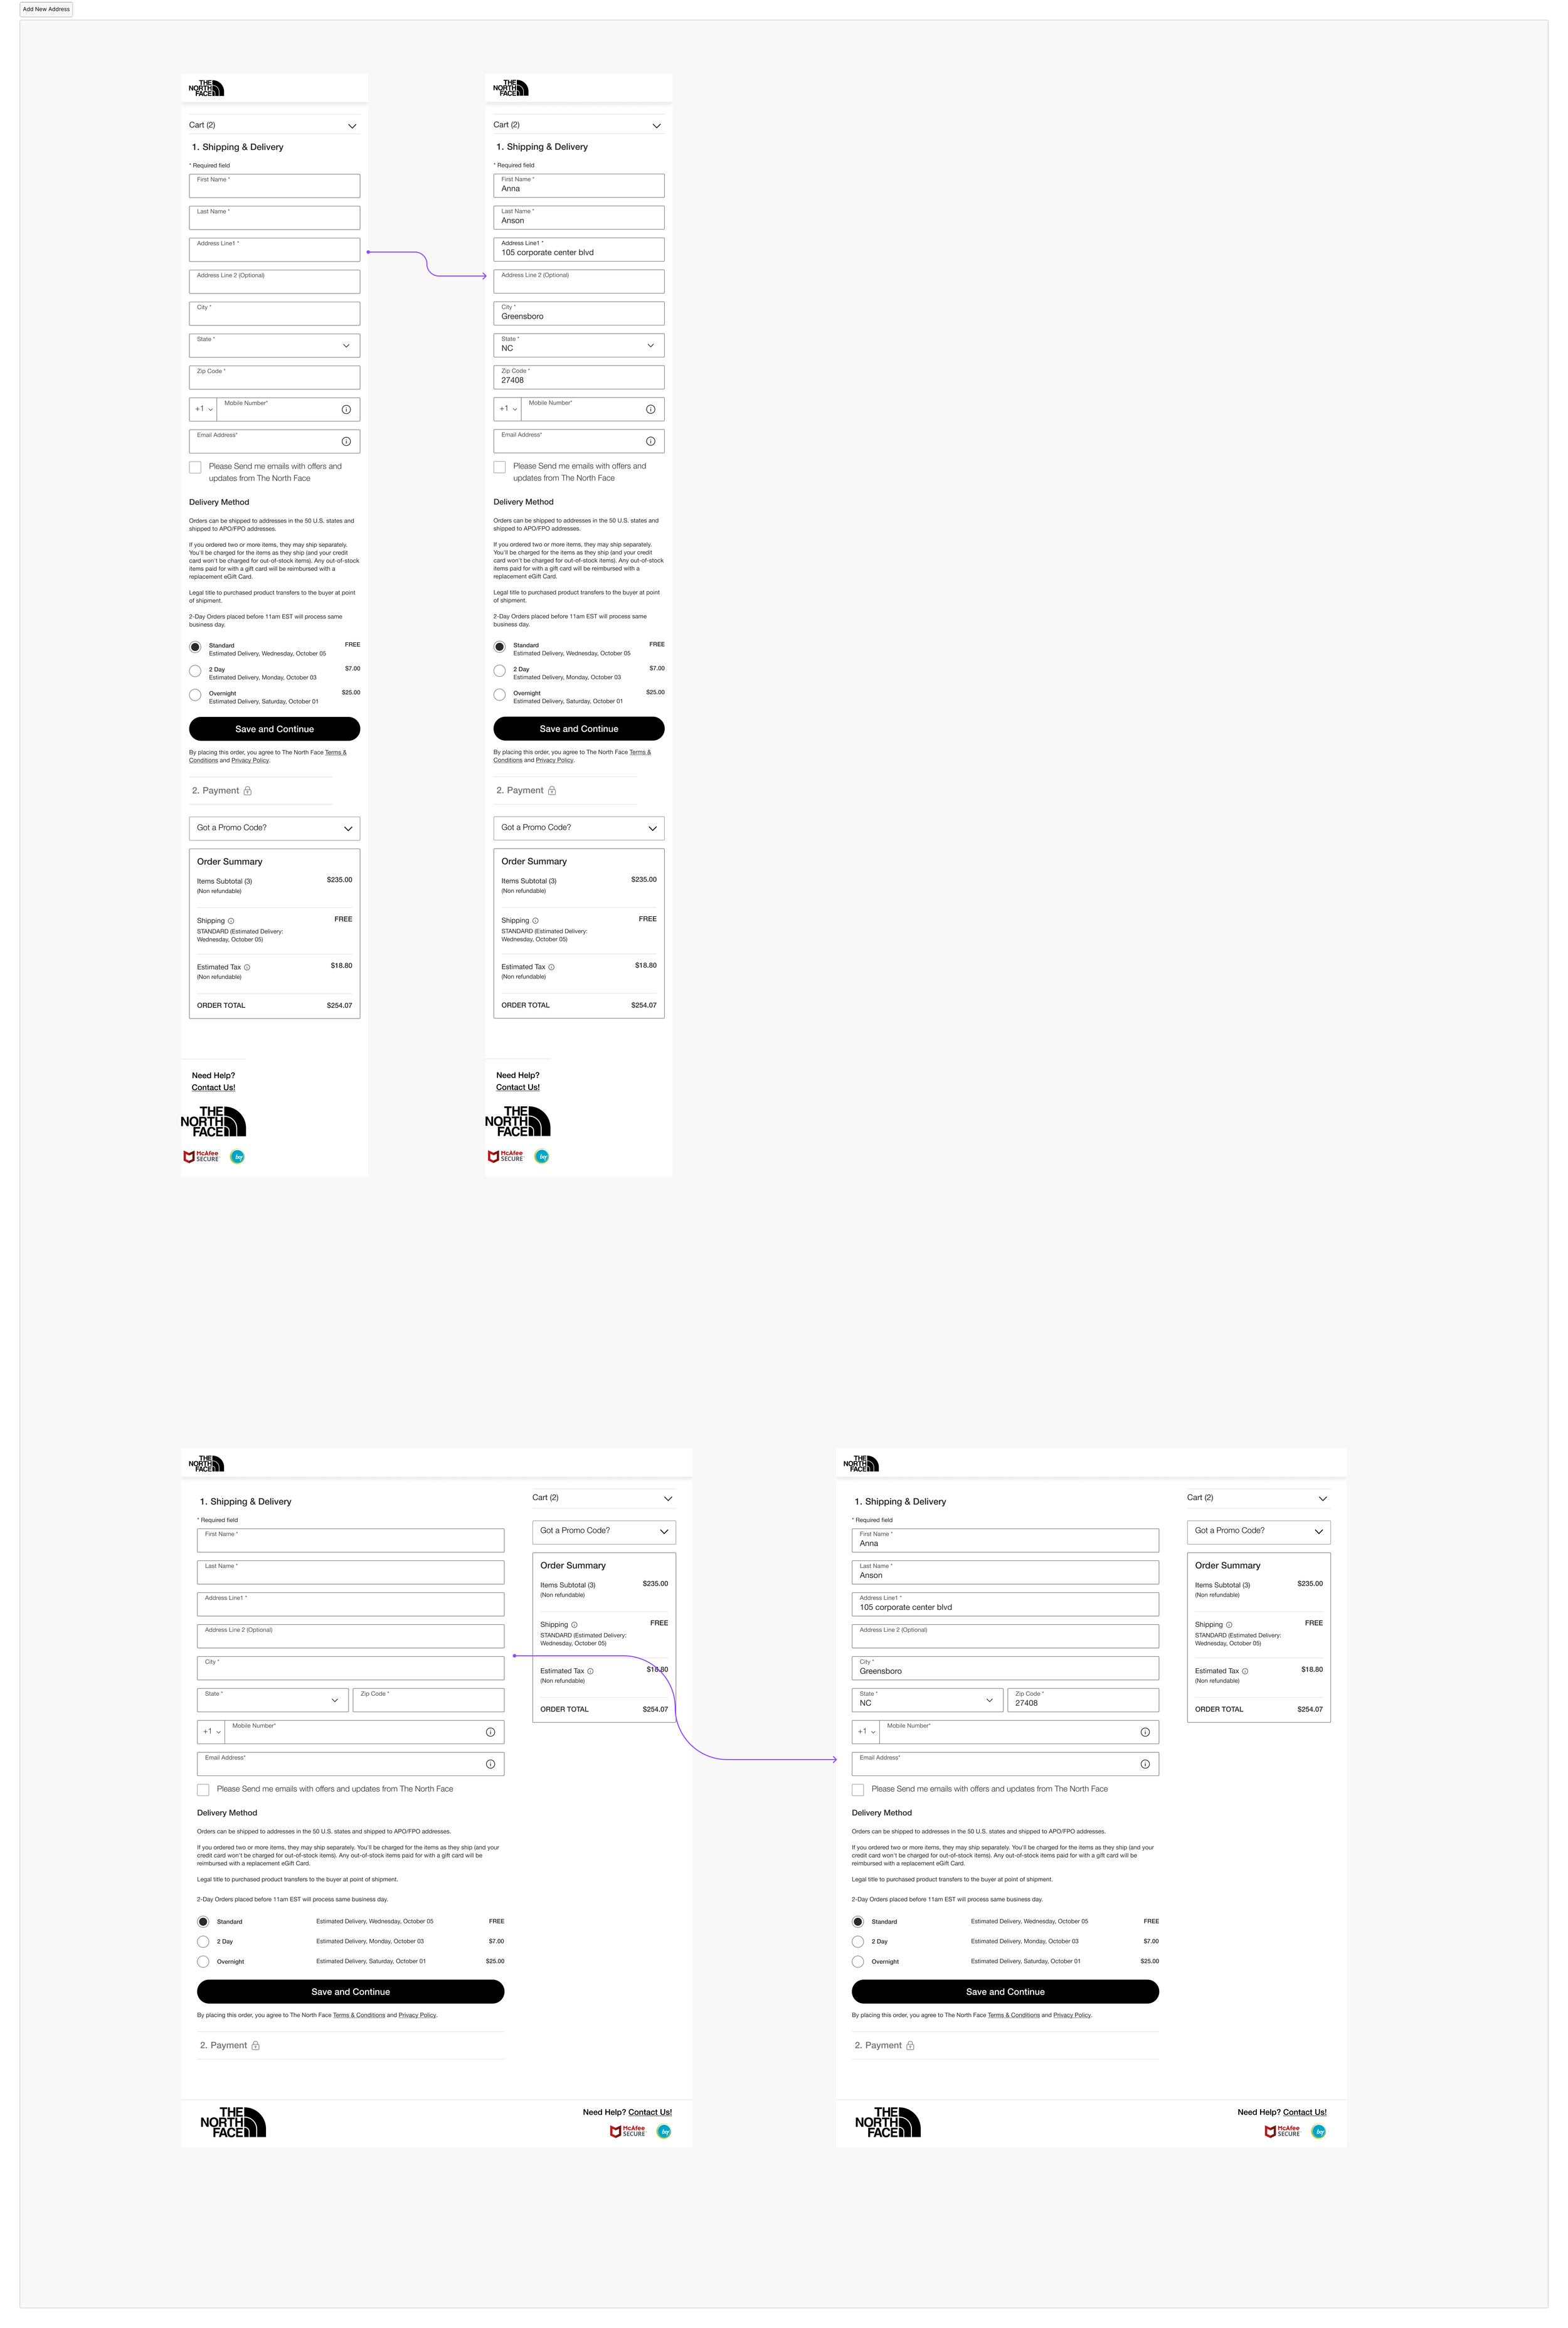
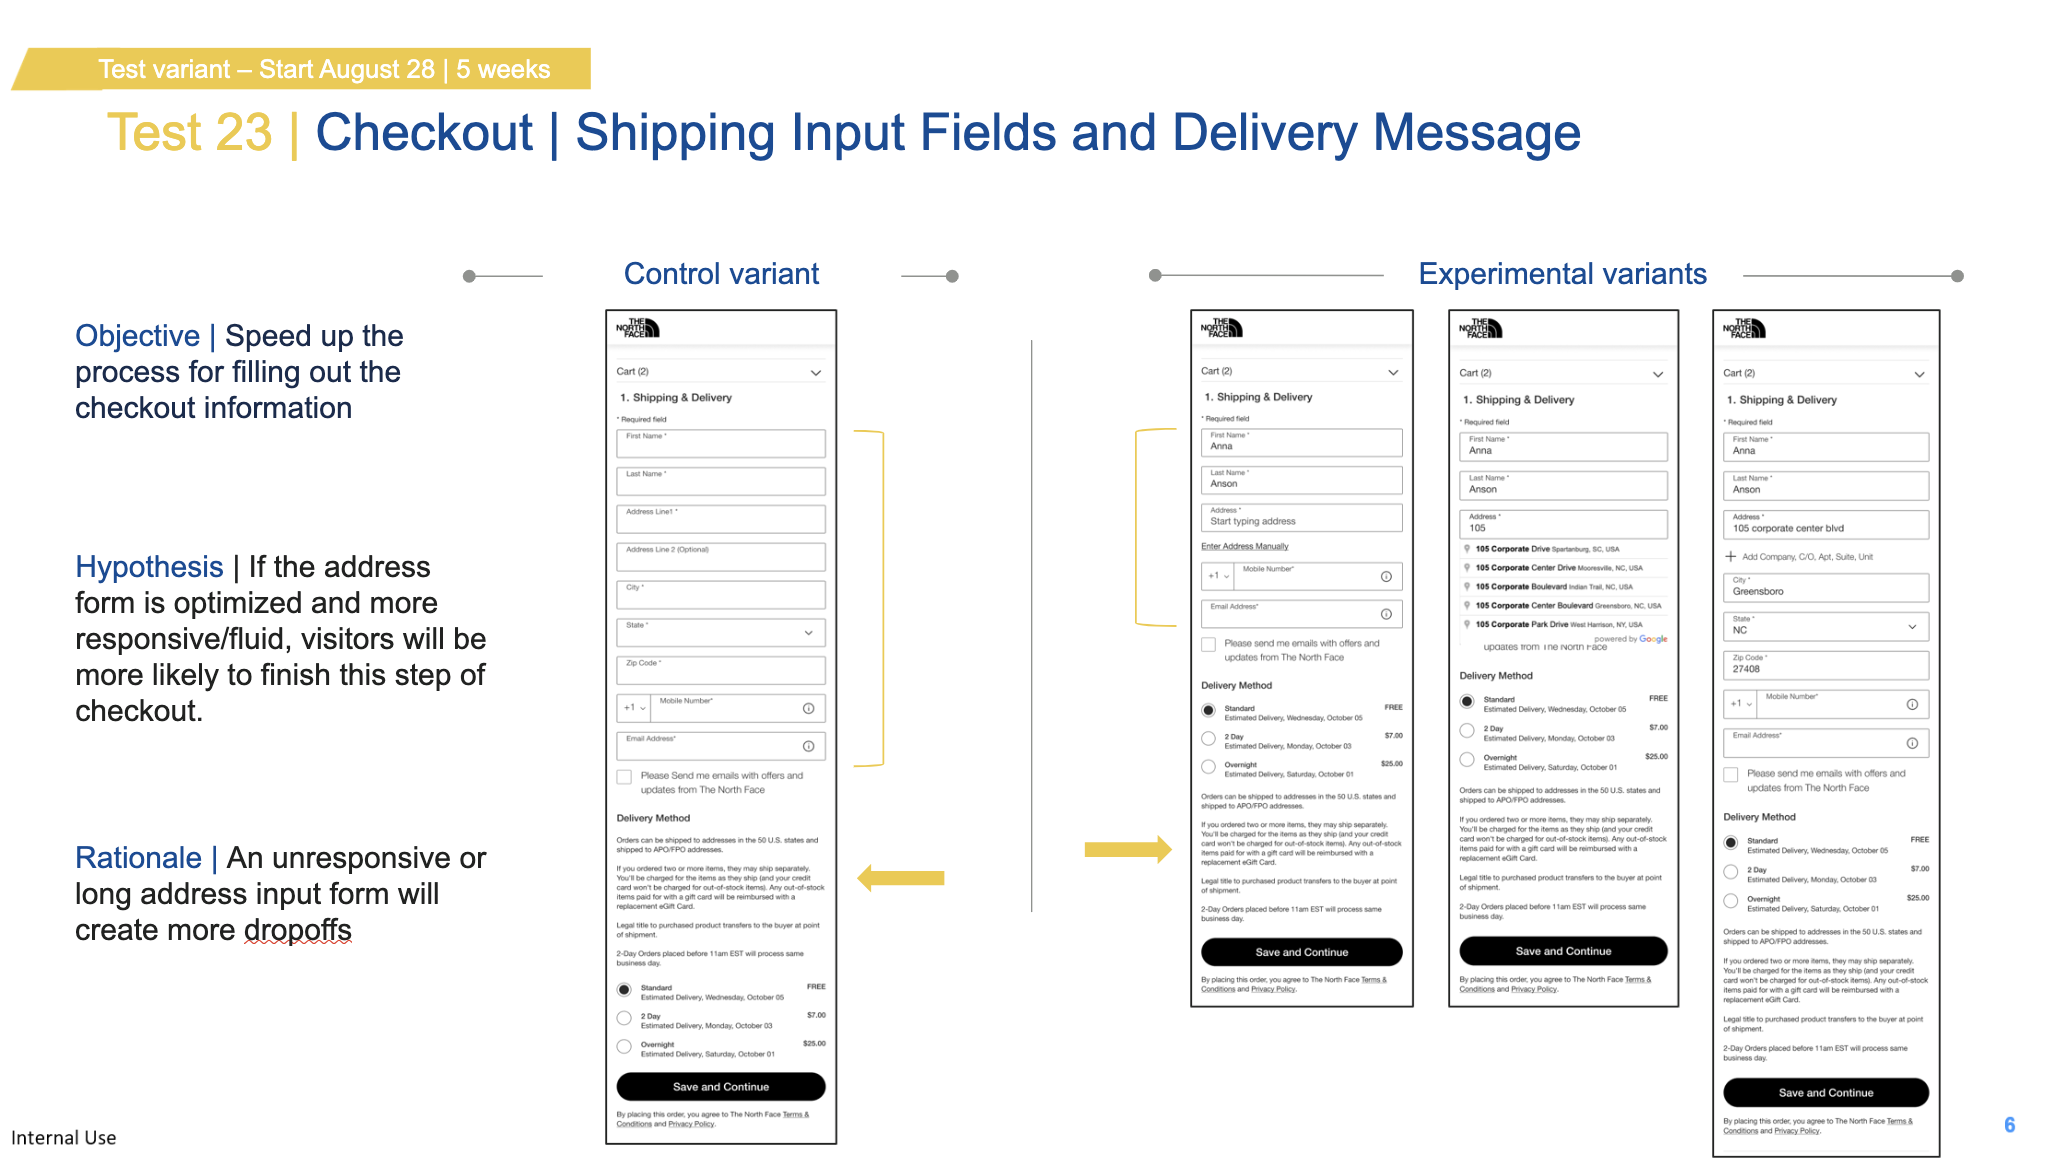
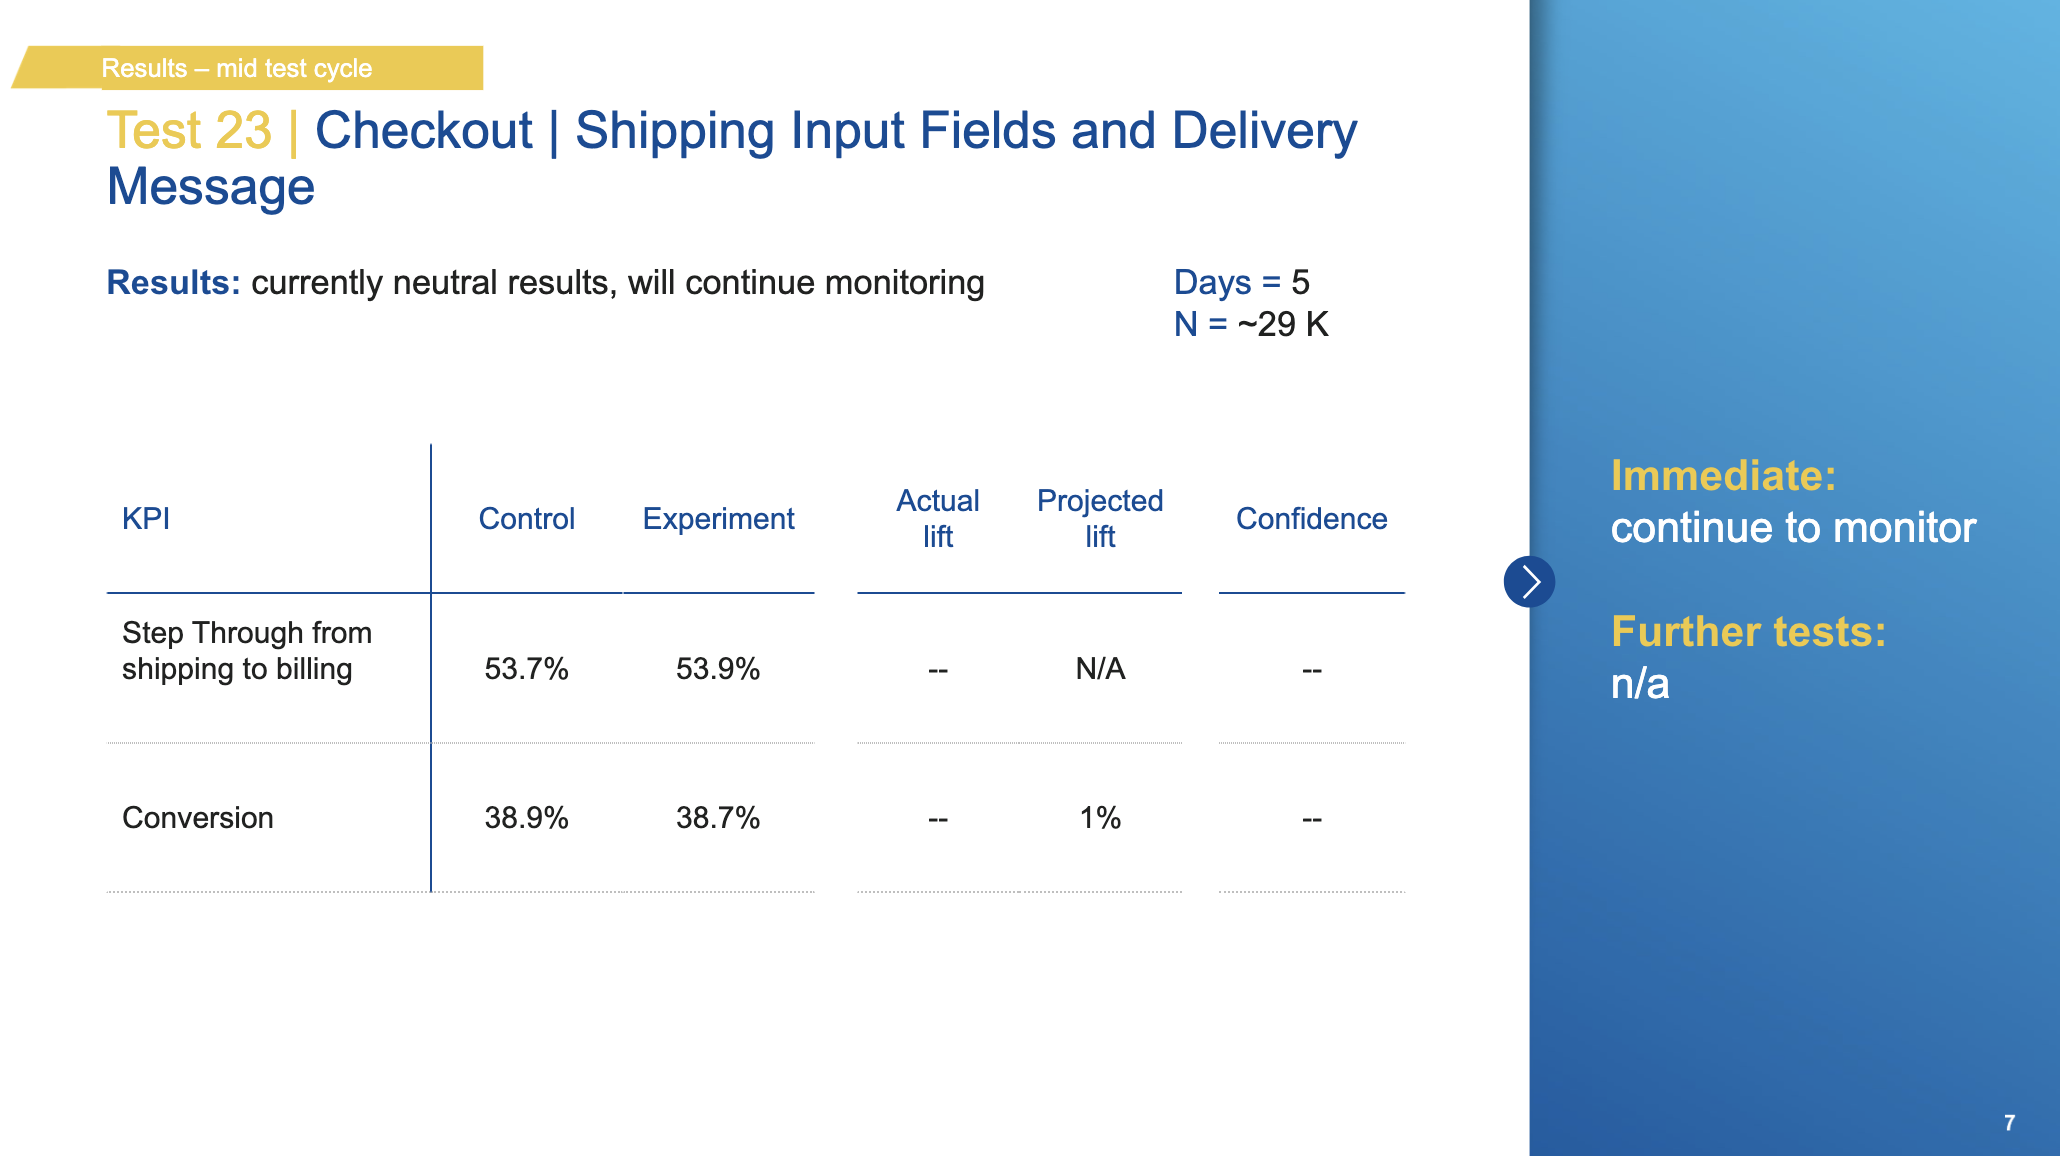
Simplify the shipping & delivery forms by reducing the number of input fields
My Role:
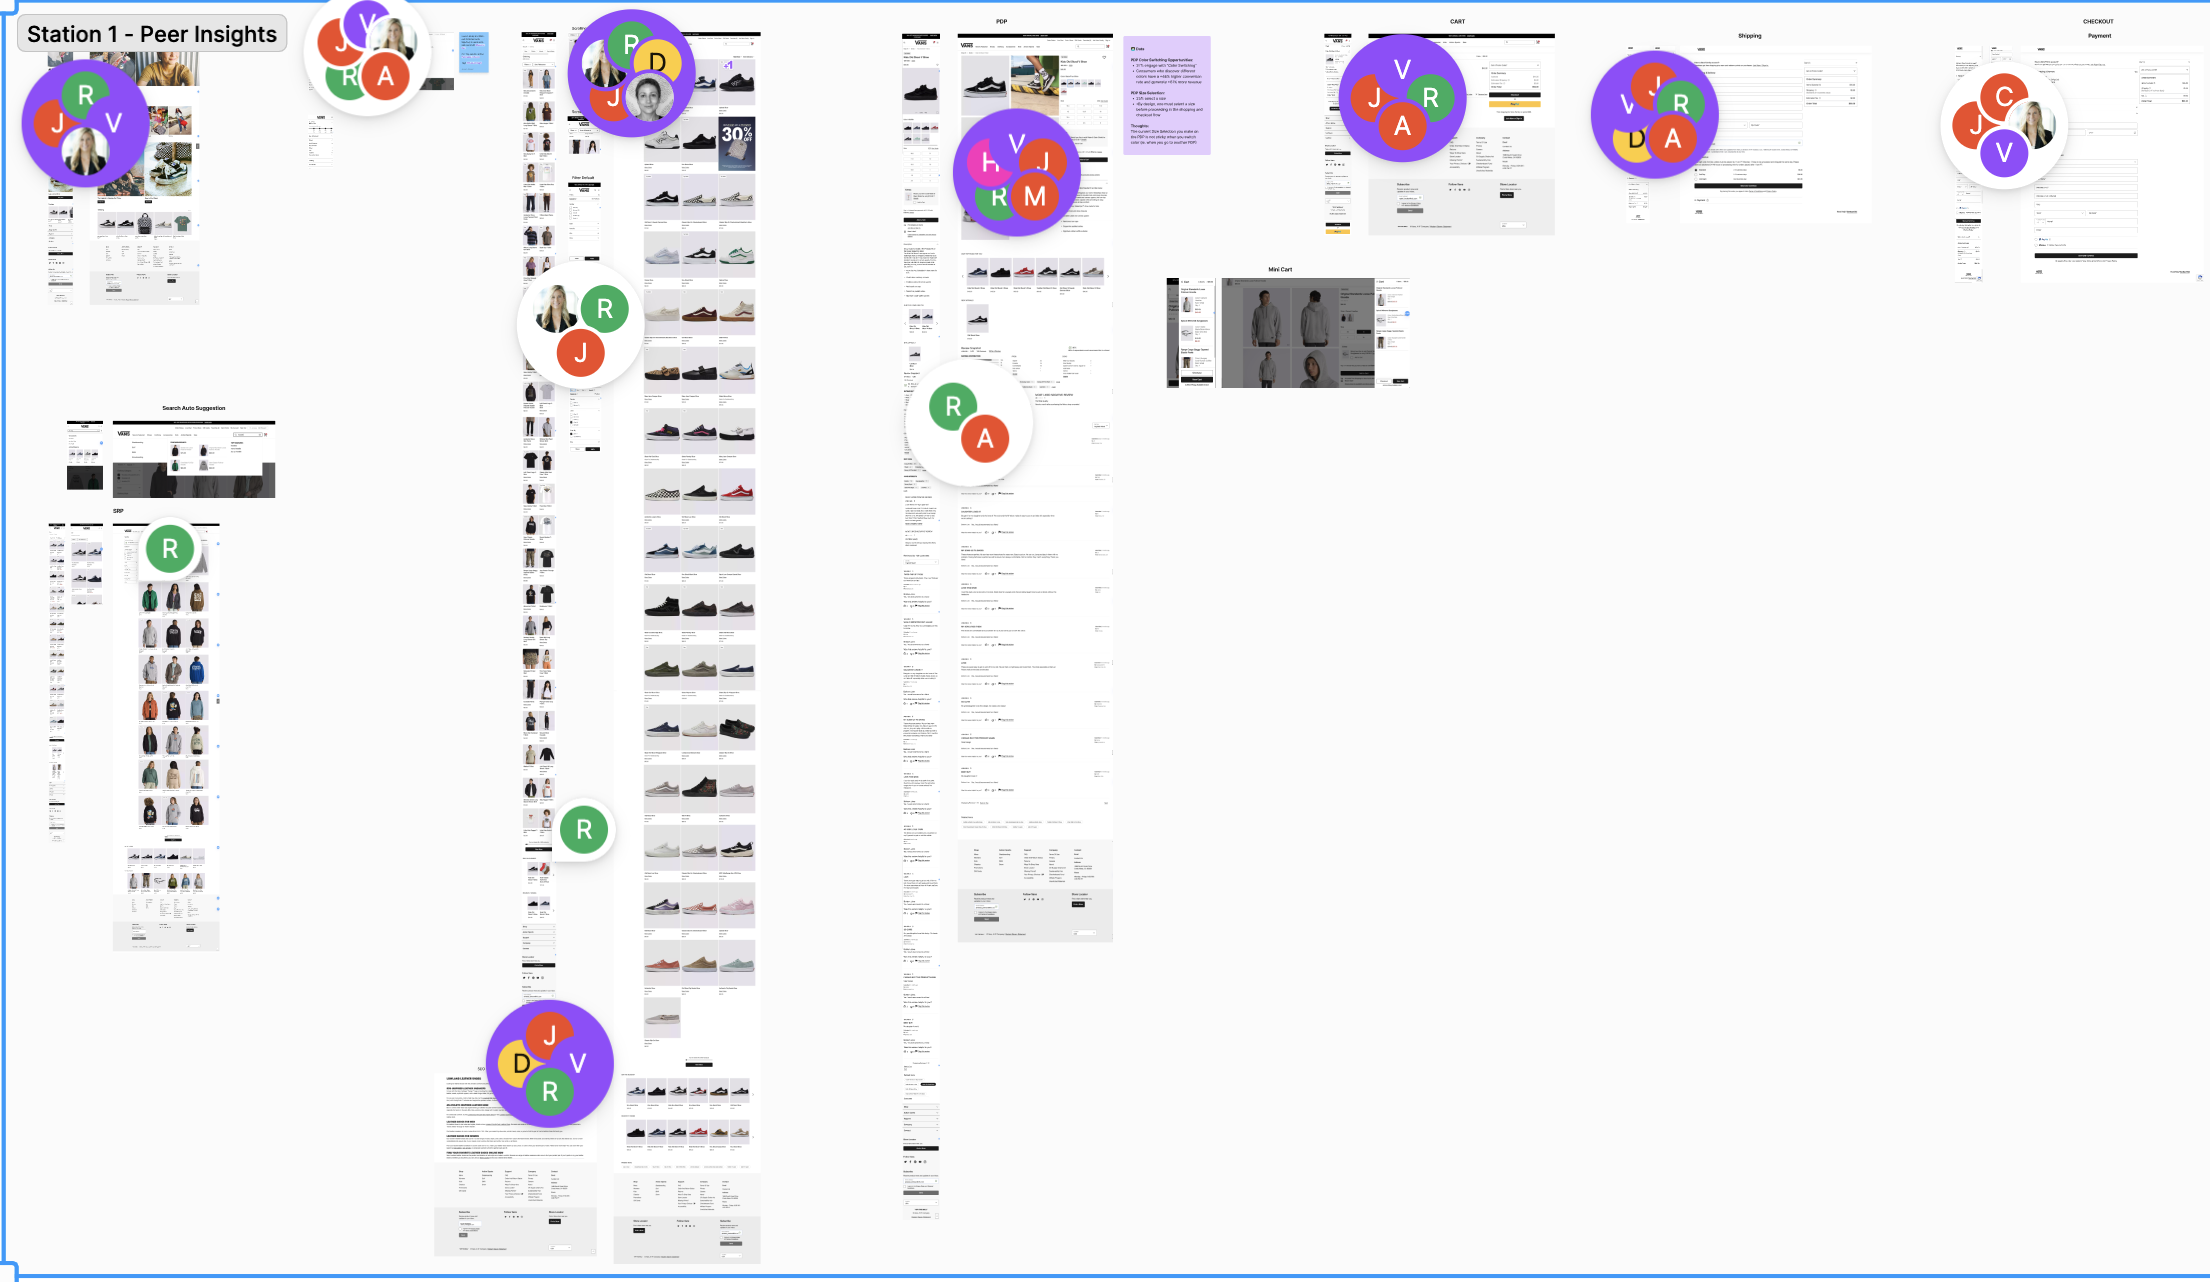
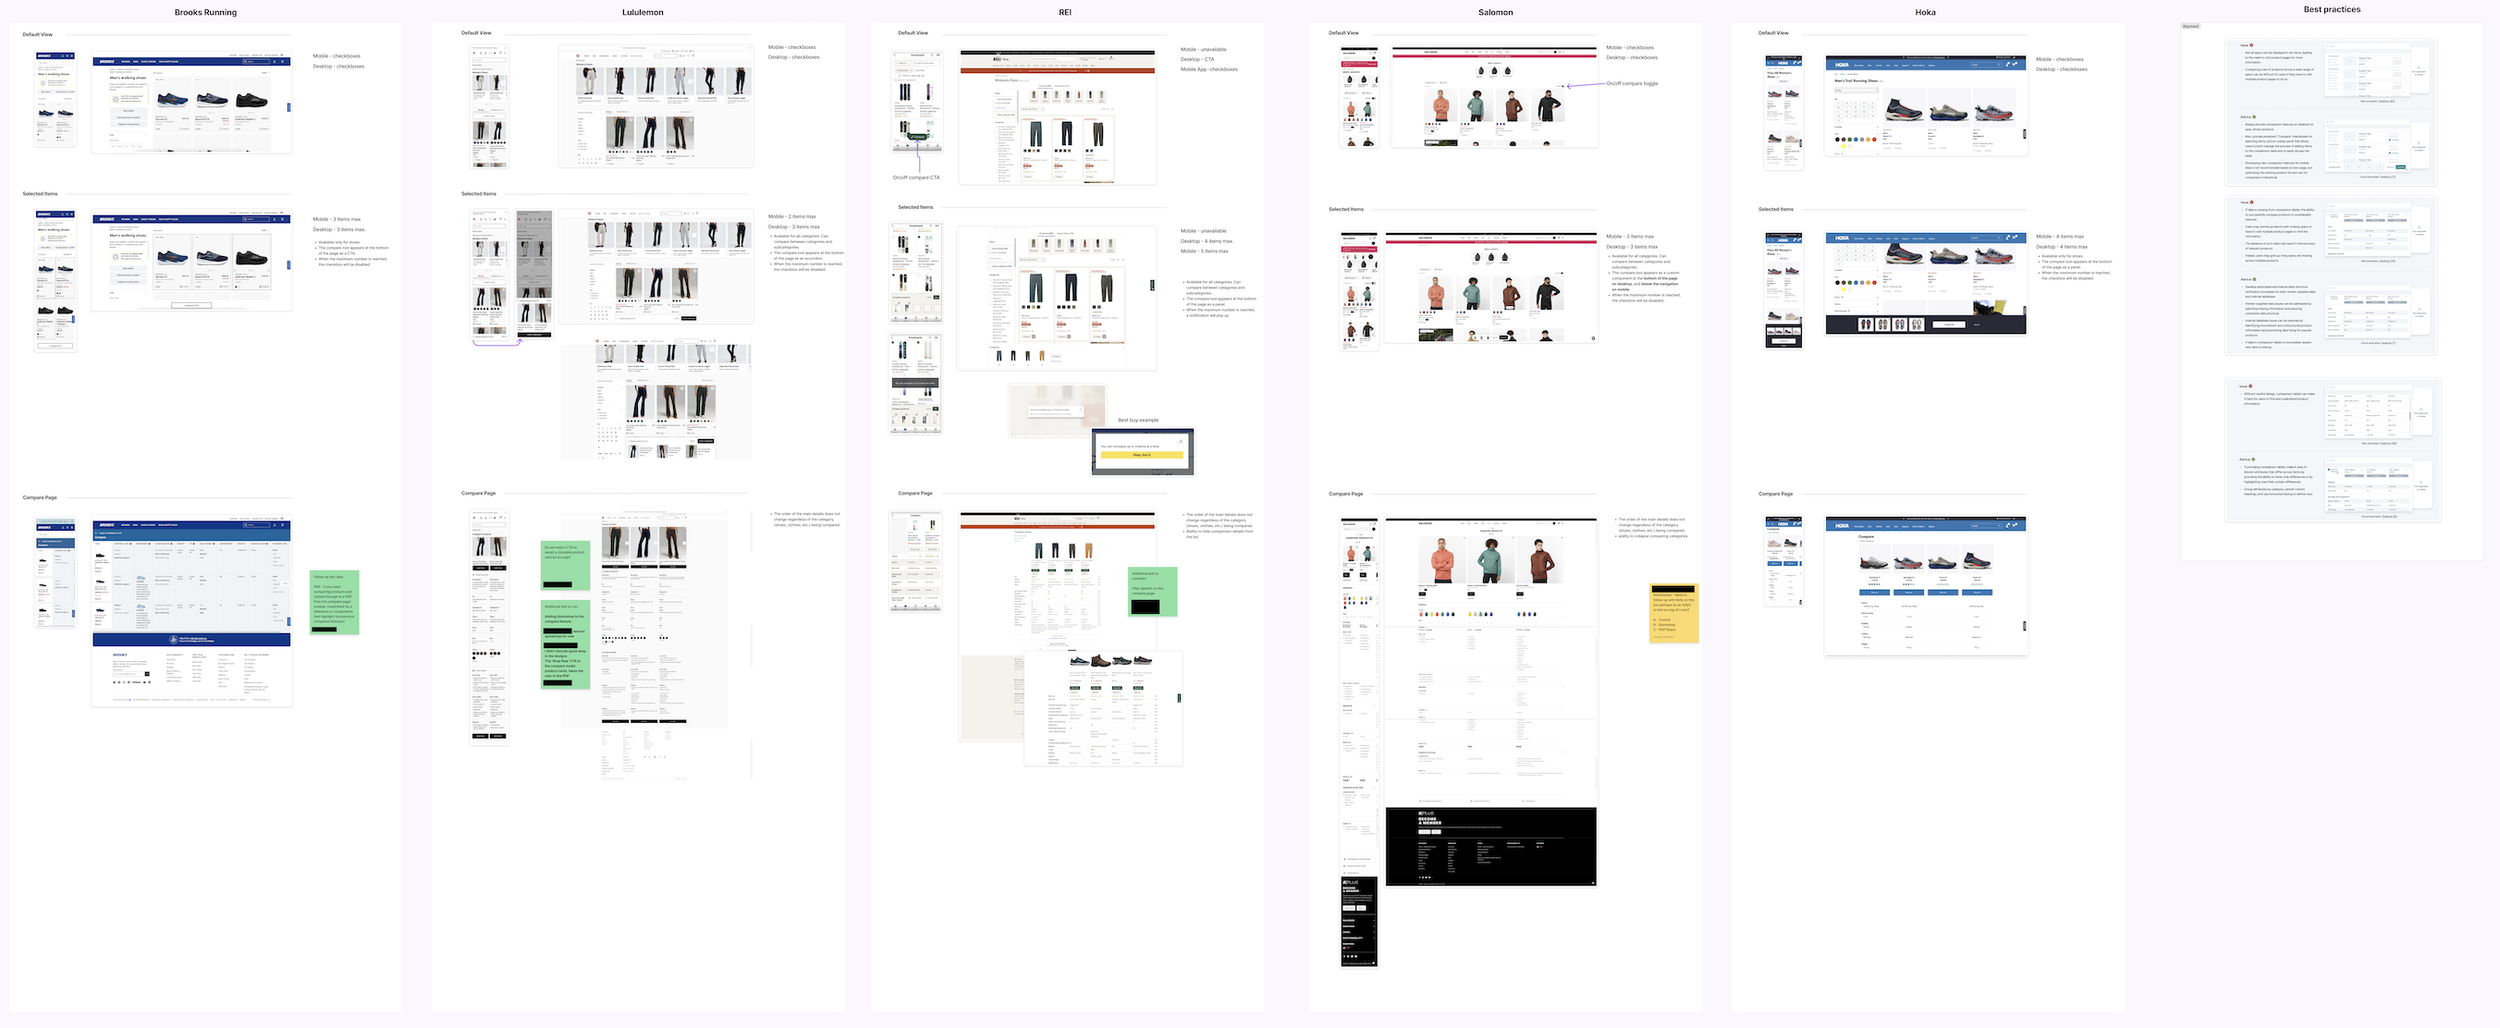
Conducted competitive analysis to benchmark and identify best practices across similar e-commerce platforms (best practices resources: NNGroup and Baymard).
Performed user research to gather insights on user behaviors and preferences (user feedback provided by the support team).
Created experimental designs for A/B testing to validate our solutions (all designs and prototypes created in Figma).
Agile Workflow:
We worked within a four-week sprint cycle in an Agile environment, collaborating efficiently to meet the project objectives. (Jira, Slack, and Zoom).
Brainstorming sessions
Prioritizing ideas/needs
Once all hypotheses were formulated and the initial tickets were created, I began developing designs and prototypes for each task.
For each task, I created 2-4 design variations, based on:
Best practices
My expertise
Research insights
These variations were then presented to the brand representative, who selected the preferred design for future A/B testing.
Discovery and Competitive Analysis
Surveys
For some tasks, I requested additional data from the UX researcher to ensure informed design decisions.
Example: Compare Feature
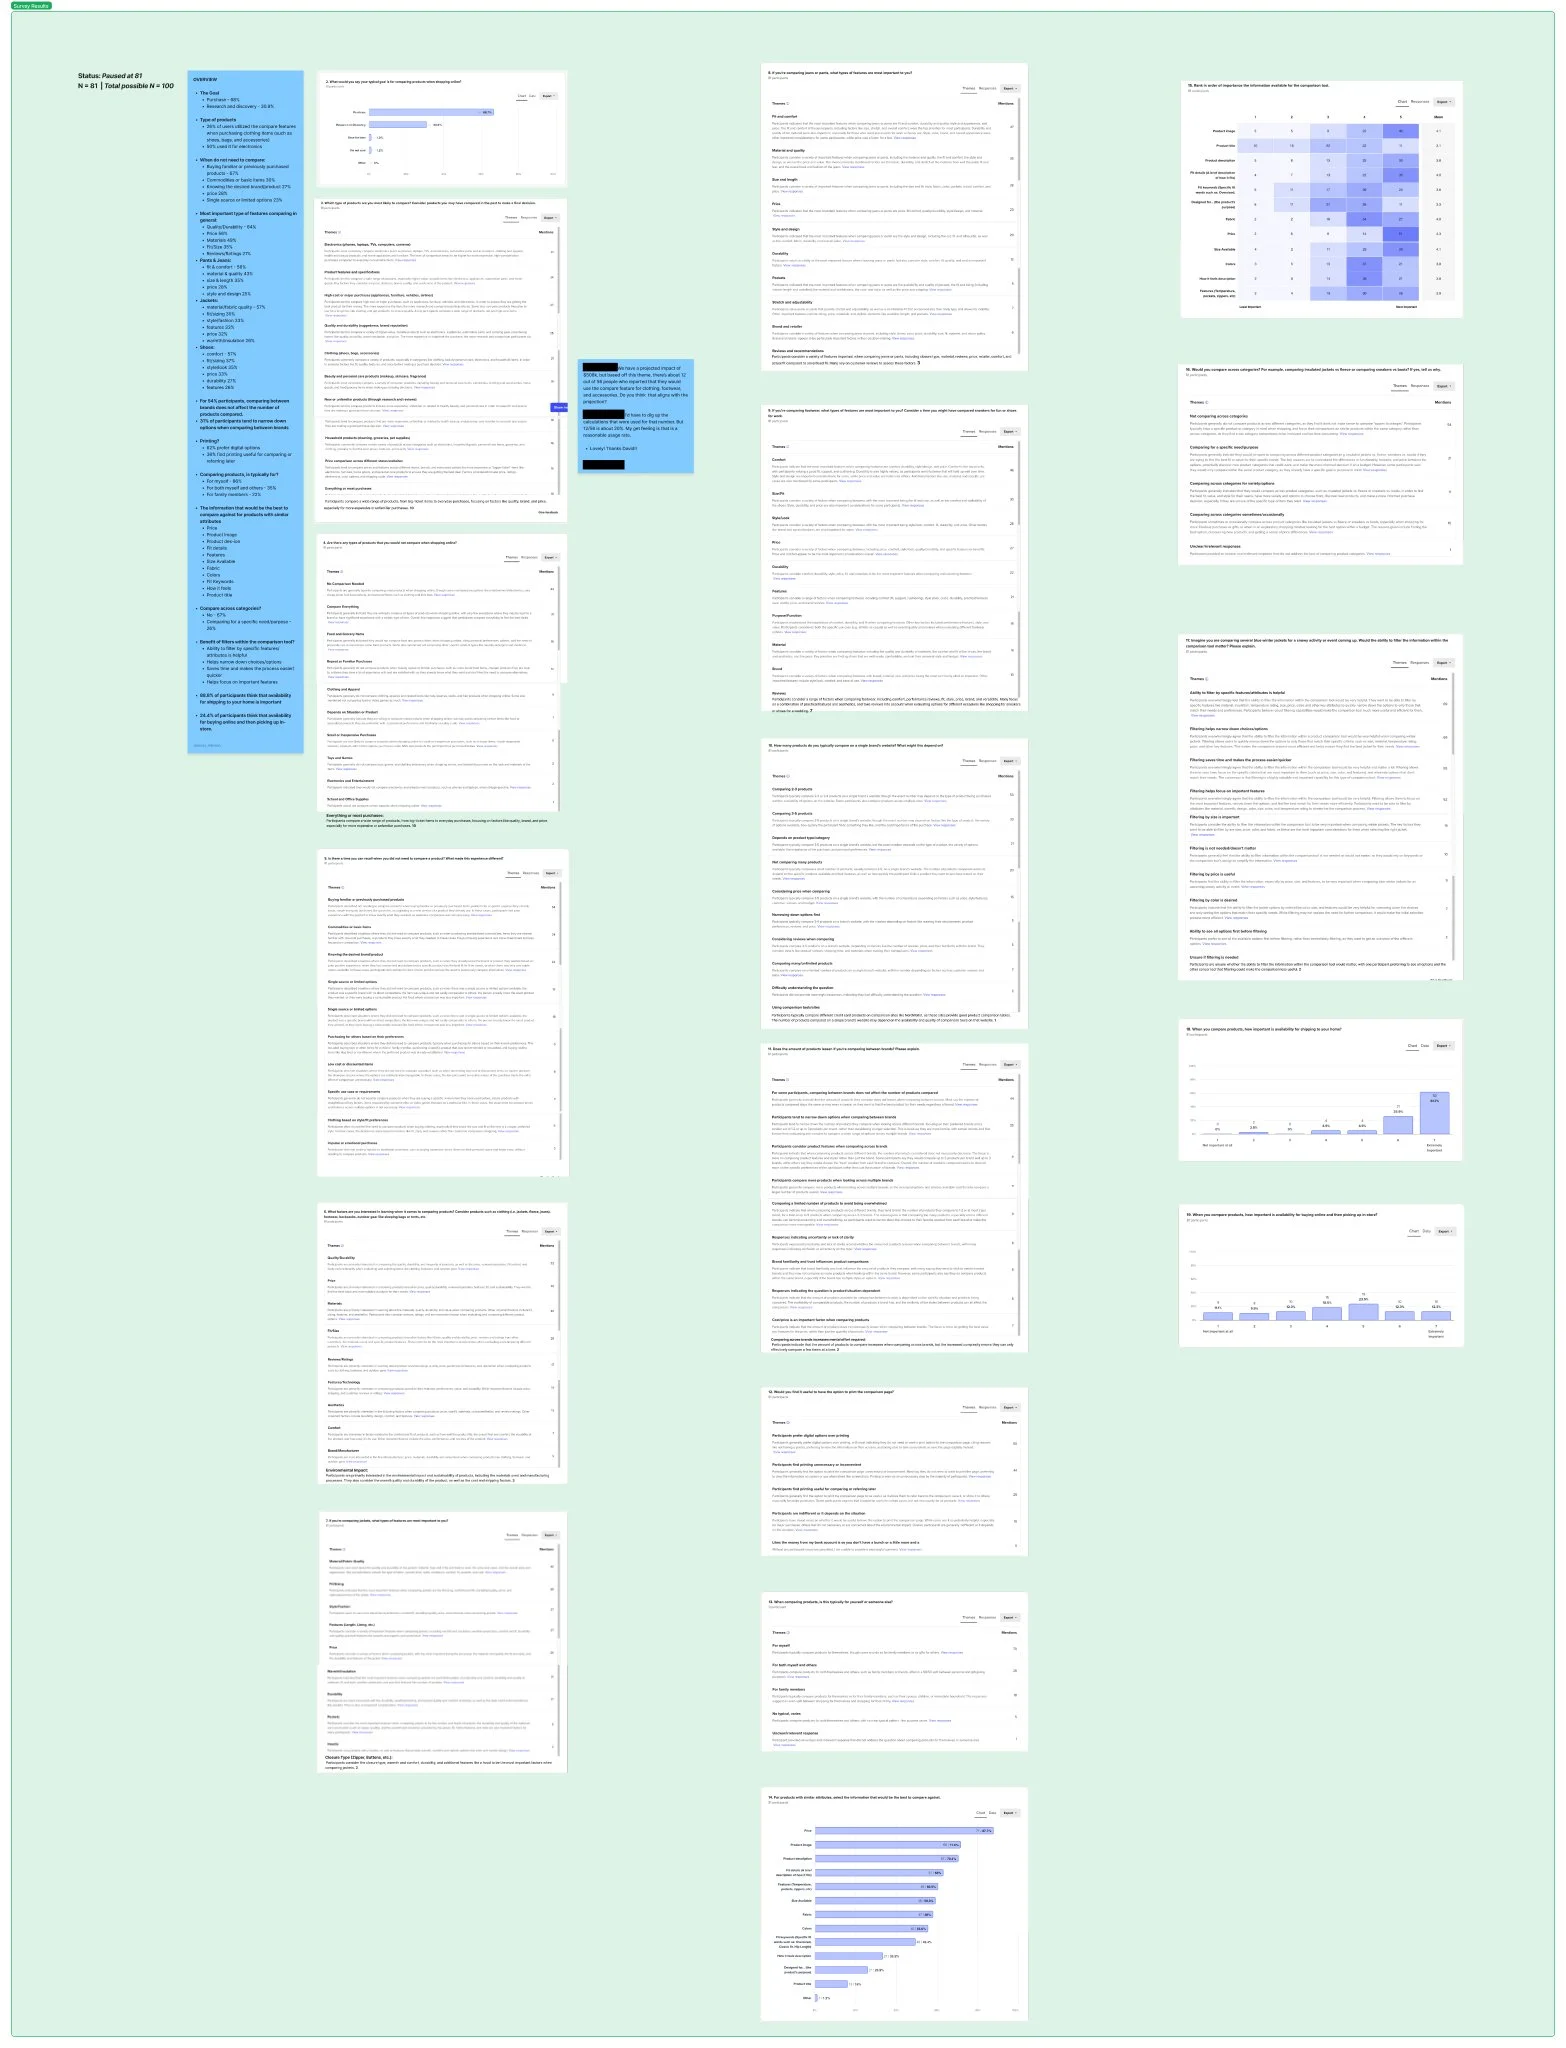
When working on the Compare Feature, we needed specific user insights, so the researcher conducted surveys to gather important details, such as:
How to sort product details from top to bottom
The optimal number of products to be compared
Differences between mobile vs. desktop variants
How particular product categories impact the Compare Feature details
After receiving the survey results, I conducted a competitive analysis to benchmark solutions from similar platforms.
With the data in hand, I started developing design variants for my tasks.
Design / User Flow / Annotations / Prototypes
Building Compare Feature
Speeding up the checkout process by reducing the number of input fields
Adding Sticky CTA to PDP for both brands and creating annotations for developers. Additionally, I created prototypes for the best communication.
A/B testing results
The ready-for-review designs were presented to both brands, and the best ones were chosen for A/B testing. After running the tests for at least two weeks, we gathered the results. (See the screens with designs and outcomes below.)
Conclusion:
Throughout this project, I gained valuable insights into the direct impact of design on both the business and its customers. Key takeaways include:
Business Impact:
Learned how design improvements can quickly drive significant business results.
Explored and implemented new features and enhancements that significantly improved the user experience.
A/B Test Results:
Positive test results contributed to increased revenue, with each test generating a minimum of $50K annually, and some tests having a much larger impact, reaching up to $1.2M.
These improvements not only reduced customer effort but also enhanced customer satisfaction, benefiting both the business and its customers.
Rapid Results:
The design enhancements delivered results rapidly, providing tangible value in a short timeframe.
Learning from Negative Results:
Negative A/B test outcomes presented new opportunities for innovation, driving further design iterations and improvements.
